| Cancer | Literature | PMID | Sequencing platform | Cell number | Data processing | Resource |
|---|---|---|---|---|---|---|
| Breast cancer | A single-cell and spatially resolved atlas of human breast cancers | 34493872 | Illumina NextSeq 500 | 130,246 | The EmptyDrops method from the DropletUtils package was applied for cell filtering with additional cutoffs for cells with a gene and unique molecular identifier (UMIs) count greater than 200 and 250, respectively, and a mitochondrial percentage less than 20%. |
GSE176078 |
| Non-small cell lung cancer | Global characterization of T cells in non-small-cell lung cancer by single-cell sequencing | 29942094 | Illumina Hiseq 2500 or Illumina Hiseq 4000 | 12,346 | Low-quality cells were discarded if the cell library size or the number of expressed genes (counts larger than 0) was smaller than pre-defined thresholds, which were the medians of all cells minus 3 × median absolute deviation. Cells were also removed if their proportions of mitochondrial gene expression were larger than 10%. Only cells with the average TPM of CD3D, CD3E and CD3G larger than 10 were kept for subsequent analysis. |
GSE99254 |
| Lung cancer | Integrated single-cell RNA sequencing analysis reveals distinct cellular and transcriptional modules associated with survival in lung cancer | 35027529 | Illumina NovaSeq 6000 | 220,716 | Samples with less than 500 cells were removed. Cells were required to have more than 1000 UMIs and only genes with more than 1000 UMIs across all cells were kept for further analyses. |
http://lungcancer.chenlulab.com/#/download |
| Lung adenocarcinoma | Single-cell RNA sequencing reveals distinct tumor microenvironmental patterns in lung adenocarcinoma | 34663877 | Illumina HiSeq 4000 | 114,489 | Transcriptomes were filtered for cells with 500–10,000 genes detected, 1000–100,000 UMIs counted, fraction of mitochondrial reads <30%, and fraction of hemoglobin reads <5%. |
Code Ocean capsule from 10.24433/CO.0121060.v1. |
| Lung cancer | Therapy-Induced Evolution of Human Lung Cancer Revealed by Single-Cell RNA Sequencing | 32822576 | Illumina NextSeq or NovaSeq 6000 | 23,261 | Standard procedures for filtering were performed using the Seurat v3 using R, where cells with fewer than 500 genes and 50,000 reads were excluded. DoubletFinder was used to identify potentially sorted doublet cells. |
NCBI BioProject #PRJNA591860 |
| Gastric cancer | Single-cell RNA sequencing reveals a pro-invasive cancer-associated fibroblast subgroup associated with poor clinical outcomes in patients with gastric cancer | 34976204 | Illumina HiSeq 4000 | 36,897 | Cells with fewer than 400 expressed genes, as well as genes expressed in less than four cells, were removed. |
wxy@ibms.pumc.edu.cn |
| Gastric cancer | Single-Cell Genomic Characterization Reveals the Cellular Reprogramming of the Gastric Tumor Microenvironment | 32060101 | Illumina sequencer | 56,167 | Cells that expressed fewer than 200 genes, had greater than 20% mitochondrial genes or had number of UMI in an outlier range indicative of potential doublets were removed. The authors also excluded genes detected in fewer than three cells. |
genomics_ji@stanford.edu |
| Hepatocellular carcinoma | Single-cell landscape of the ecosystem in early-relapse hepatocellular carcinoma | 33357445 | BGISEQ500 | 16,498 | The authors defined genes with TPM > 1 as detected genes. To filter out low-quality cells they set the following criterion: 1). Mapping reads ≥ 1 M; 2). Mapping rate ≥ 30%; 3). 1,500 ≤ detected genes number ≤ 10,000. |
fan.jia@zs-hospital.sh.cn |
| Liver cancer | A single cell atlas of the human liver tumor microenvironment | 33332768 | NextSeq 550 | 7,947 | Cells with UMI counts below 200 or higher than 3,000 or mitochondrial content above 35% were removed. |
GSE146409 |
| Pancreatic ductal adenocarcinoma | Single-cell RNA-seq highlights intra-tumoral heterogeneity and malignant progression in pancreatic ductal adenocarcinoma | 31273297 | Illumina HiSeq X Ten | 57,530 | Low quality cells (<200 genes/cell, <3 cells/gene and >10% mitochondrial genes) were excluded. |
GSA:CRA001160 |
| Prostate cancer | Single-cell analysis of human primary prostate cancer reveals the heterogeneity of tumor-associated epithelial cell states | 35013146 | Seq-Well | 21,743 | Cells with less than 300 genes, 500 transcripts, or a mitochondrial level of 20% or greater, were filtered out. Then, an upper threshold for the number of genes per cell in each individual sample was set in order to filter potential doublets. |
GSE176031 |
| Renal cell carcinoma | Identification of a novel cancer stem cell subpopulation that promotes progression of human fatal renal cell carcinoma by single-cell RNA-seq analysis | 33162821 | Illumina Hiseq X | 15,208 | To guarantee the quality of sequencing, the cells with <200 or > 5000 genes were depleted from the original data |
cuixingang@smmu.edu.cn |
| Renal cell carcinoma | Single-cell transcriptomics reveals a low CD8+ T cell infiltrating state mediated by fibroblasts in recurrent renal cell carcinoma | 35121646 | Illumina NovaSeq 6000 | 32,073 | Low-quality cells were removed following 3 measurements: 1) cells had either fewer than 200 or over 6000 unique molecular identifiers (UMIs), over 20,000 or less than 200 expressed genes or over 15% UMIs derived from the mitochondrial genome, or over 2.5% UMIs derived from the erythrocytic genome; 2) cells had an average expression level of less than 2 for a curated list of housekeeping genes; 3) cells had a co-expression of EPCAM and PTPRC. 4) Doublets were detected by DoubletFinder R package for single sample and manually detected the doublets in re-clustering the cell types. |
zhangzhl@sysucc.org.cn |
| Colorectal cancer | Multiregion single-cell sequencing reveals the transcriptional landscape of the immune microenvironment of colorectal cancer | 33463049 | BGISEQ500 | 15,115 | Cells with less than 500 genes (TPM > 1) or over 20% TPM derived from the mitochondrial genome were removed. |
CNGB Nucleotide Sequence Archive; CNP0000916 |
| Head and neck squamous cell carcinoma | Investigating immune and non-immune cell interactions in head and neck tumors by single-cell RNA sequencing | 34921143 | Illumina NextSeq 500/550 | 134,606 | Based on the QC metrics suggested in the Scanpy tutorial, cells with less than 200 genes expressed were filtered out. Cells expressing more than 5000 genes, and more than ten percent mitochondrial genes were also removed. Genes expressed in less than 3 cells were also filtered out of the analysis. |
NCBI Sequence Read Archive: accession ID SRP301444. |
| Head and neck squamous cell carcinoma | Immune Landscape of Viral- and Carcinogen-Driven Head and Neck Cancer | 31924475 | Illumina NextSeq 500 | 131,224 | After creation of the gene/barcode matrix, a cell-level filtering step was performed to remove cells with either few genes per cell (<200) or many molecules per cell (>20,000). Next, genes that were lowly expressed (fewer reads than 3 counts in 1% of cells, or genes expressed in fewer than 1% of cells) across all samples were removed. |
GSE139324 |
| Nasopharyngeal carcinoma | Tumour heterogeneity and intercellular networks of nasopharyngeal carcinoma at single cell resolution | 33531485 | Illumina HiSeq X Ten | 176,447 | The R package “DoubletFinder” was applied to predict doublets in the data. The authors removed doublets in each sample individually, with an expected doublet rate of 0.05 and default parameters used otherwise. Next, any cells were removed for which had either less than 101 UMIs, or expression of less than 501 genes, or over 15% UMIs linked to mitochondrial genes. |
GSE162025 |
| Neuroblastoma | Single-cell transcriptomic analyses provide insights into the developmental origins of neuroblastoma | 33767450 | Illumina NextSeq 500 | 100,337 | The R package Seurat was used to calculate the quality control metrics35. Cells were removed from the analysis if fewer than 500 distinct genes, 1,000 counts or more than 2.5% of reads mapping to mitochondrial genes were detected, for data generated with the Chromium Next GEM Single Cell 3' Kit v.3.1 (10x Genomics). For the Chromium Single Cell 3' Kit v.2 (10x Genomics) data, cells with fewer than 300 distinct genes, 1,000 counts or more than 2.5% of reads mapping to mitochondrial genes were filtered. Doublets were detected and filtered using the R package DoubletFinder with default settings. Genes that were expressed in fewer than three cells were excluded. |
GSE163431 |
| Esophageal squamous cell carcinoma | Dissecting esophageal squamous-cell carcinoma ecosystem by single-cell transcriptomic analysis | 34489433 | Illumina HiSeq X Ten | 208,659 | For quality filtering, the authors removed genes whose expressions were detected in <0.1% of all cells and filtered out cells that had gene counts <500 or mitochondrial RNA content >20%. The Seurat package (version 2.3.4) was used for quality filtering. |
GSE160269 |
| Esophageal squamous cell carcinoma | Integrated single-cell transcriptome analysis reveals heterogeneity of esophageal squamous cell carcinoma microenvironment | 34921160 | Illumina Hiseq X (PE150) | 62,161 | Potential doublets were detected and filtered using DoubletFinder based on the expression proximity of each cell to artificial doublets. Further, cells with high mitochondrial content (>= 20%) were removed. |
Sequence Read Archive (SRA) under accession number PRJNA777911. |
| Cervical cancer | Single-Cell RNA Sequencing Reveals Multiple Pathways and the Tumor Microenvironment Could Lead to Chemotherapy Resistance in Cervical Cancer | 34900703 | Illumina NovaSeq 6000 | 24,371 | The number of unique molecular identifiers (UMIs), the number of genes, and the percentage of mitochondrial genes were examined for quality control. Cells expressing <500 or >4,000 genes (potential cell duplets) and gene expression not detected in fewer than three cells were trimmed from the library. |
shenchao@whu.edu.cn |
| Multiple myeloma | Single-cell RNA sequencing infers the role of malignant cells in drug-resistant multiple myeloma | 34918874 | Illumina HiSeq X Ten | 52,793 | To obtain cells with high quality, the ratio of mitochondria lower than 0.2 and cells with genes over 2000 were maintained. |
wangliangtrhos@126.com |
| Endometrial carcinoma | Phenotyping of immune and endometrial epithelial cells in endometrial carcinomas revealed by single-cell RNA sequencing | 33429363 | Illumina HiSeq X Ten | 30,780 | Genes detected in < 3 cells and cells where < 100 genes had nonzero counts were excluded. Low-quality cells that had > 5% mitochondrial genes were discarded. |
The SRA accession number is PRJNA650549. |
| Osteosarcoma | Single-cell RNA landscape of intratumoral heterogeneity and immunosuppressive microenvironment in advanced osteosarcoma | 33303760 | Illumina HiSeq X | 100,987 | The cells with no. of expressed genes <300 genes or the percent of mitochondrial genes over 10% of total expressed genes were filtered out. Further, the DoubletFinder package of the R was used to remove the potential doublets (and to an even lesser extent of higher-order multiplets) that occurred in the encapsulation step and/or as occasional pairs of cells that were not dissociated in sample preparation. |
GSE152048 |
| Ovarian cancer | Identification of grade and origin specific cell populations in serous epithelial ovarian cancer by single cell RNA-seq | 30383866 | Illumina NextSeq 500 | 2,911 | The R software package Seurat was used for further analysis. Genes were initially filtered on expression in at least three cells and each cell needed to have at least 200 genes expressed. |
GSE118828 |
| Uveal melanoma | Single-cell analysis reveals new evolutionary complexity in uveal melanoma | 31980621 | Illumina NextSeq 500 | 59,915 | Filtering was conducted by retaining cells that had unique molecular identifiers (UMIs) greater than 400, expressed 100 and 8000 genes inclusive, and had mitochondrial content less than 10 percent. |
GSE139829 |
| T-cell lymphoma | Single-cell RNA sequencing reveals markers of disease progression in primary cutaneous T-cell lymphoma | 34583709 | Illumina NovaSeq 6000 | 47,172 | The command “doubletCells” simulates thousands of doublets by adding together two randomly chosen single cell profiles. For each cell the number of simulated doublets in the neighborhood was recorded and used as input to calculate a doublet score. Threshold to filter putative doublets was set to three times the median absolute deviation of the doublet score and all cells with a higher score were discarded. |
GSE173205 |
| Thyroid cancer | Characterizing dedifferentiation of thyroid cancer by integrated analysis | 34321197 | Illumina NovaSeq | 46,205 | Several criteria were set to filter low-quality cells and genes: minimal expression of 200 genes per cell, mitochondrial content less than 15%, and genes that are expressed in more than 3 cells. |
Access number: HRA000686, https://bigd.big.ac.cn/gsa-human/browse/. |
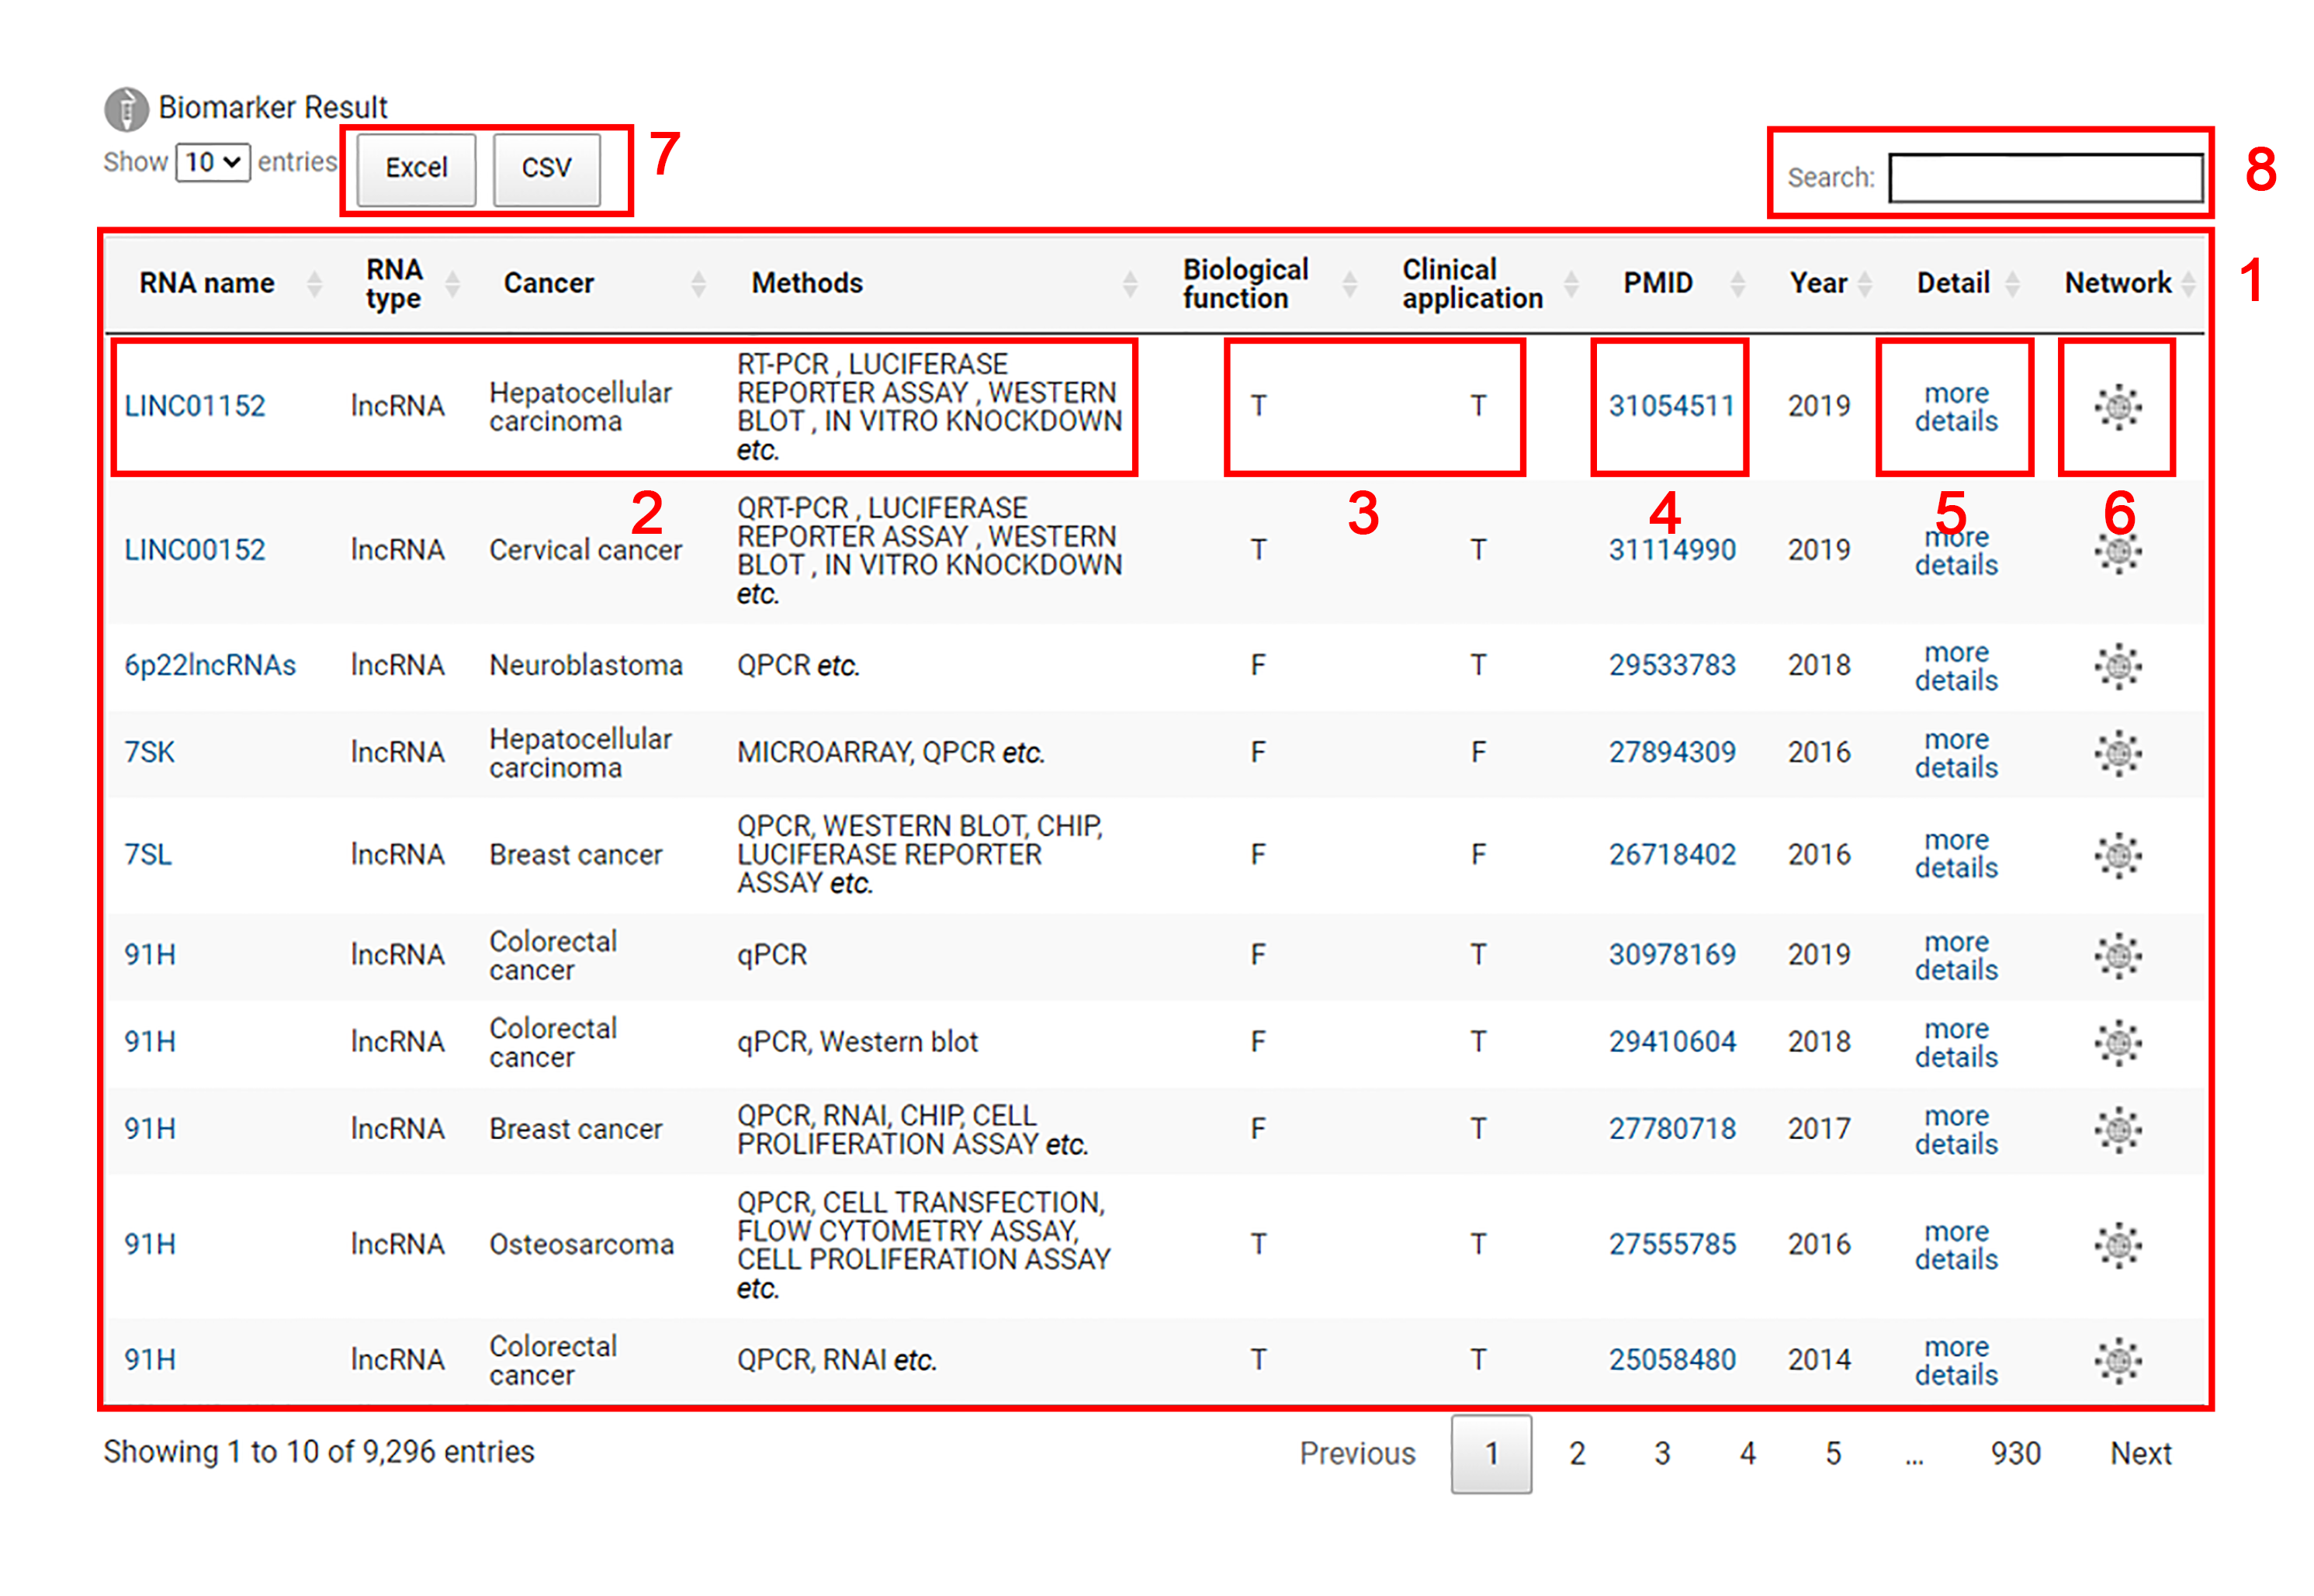
On the Browse page, users can browse SCancerRNA by clicking on diagrams related to the categories (RNA type, biological function, clinical application and tissue) listed above. The result page is shown in the figure below.
Biomarker Result

1. The results for non-coding biomarkers are displayed.
2. Each entry includes the name of the non-coding RNA biomarker, the RNA type of the biomarker, the type of the cancer and the testing methods of the non-coding RNA biomarker.
3. Users can explore whether this biomarker is related to biological function and clinical application through T or F. The specific biological functions (cell proliferation, growth, apoptosis, autophagy and epithelial mesenchymal transformation) and clinical applications (migration, metastasis, circulation, survival and recurrence) of biomarkers can be checked by clicking ‘Detail’ button.
T:This biomarker is associated with this listed biological function or clinical application.
F:This biomarker is not associated with this listed biological function or clinical application.
4. Users are allowed to acquire more detailed information in the original literature corresponding to the biomarker by clicking the 'PMID' link.
5. Users can click the ‘more details’ button to check detailed information for the ncRNA biomarker.
6. By clicking on the network logo, the interaction network of different types of ncRNA biomarkers will be shown.
7. Biomarker results can be downloaded in excel or csv format.
8. Input an interested non-coding RNA biomarker for search.
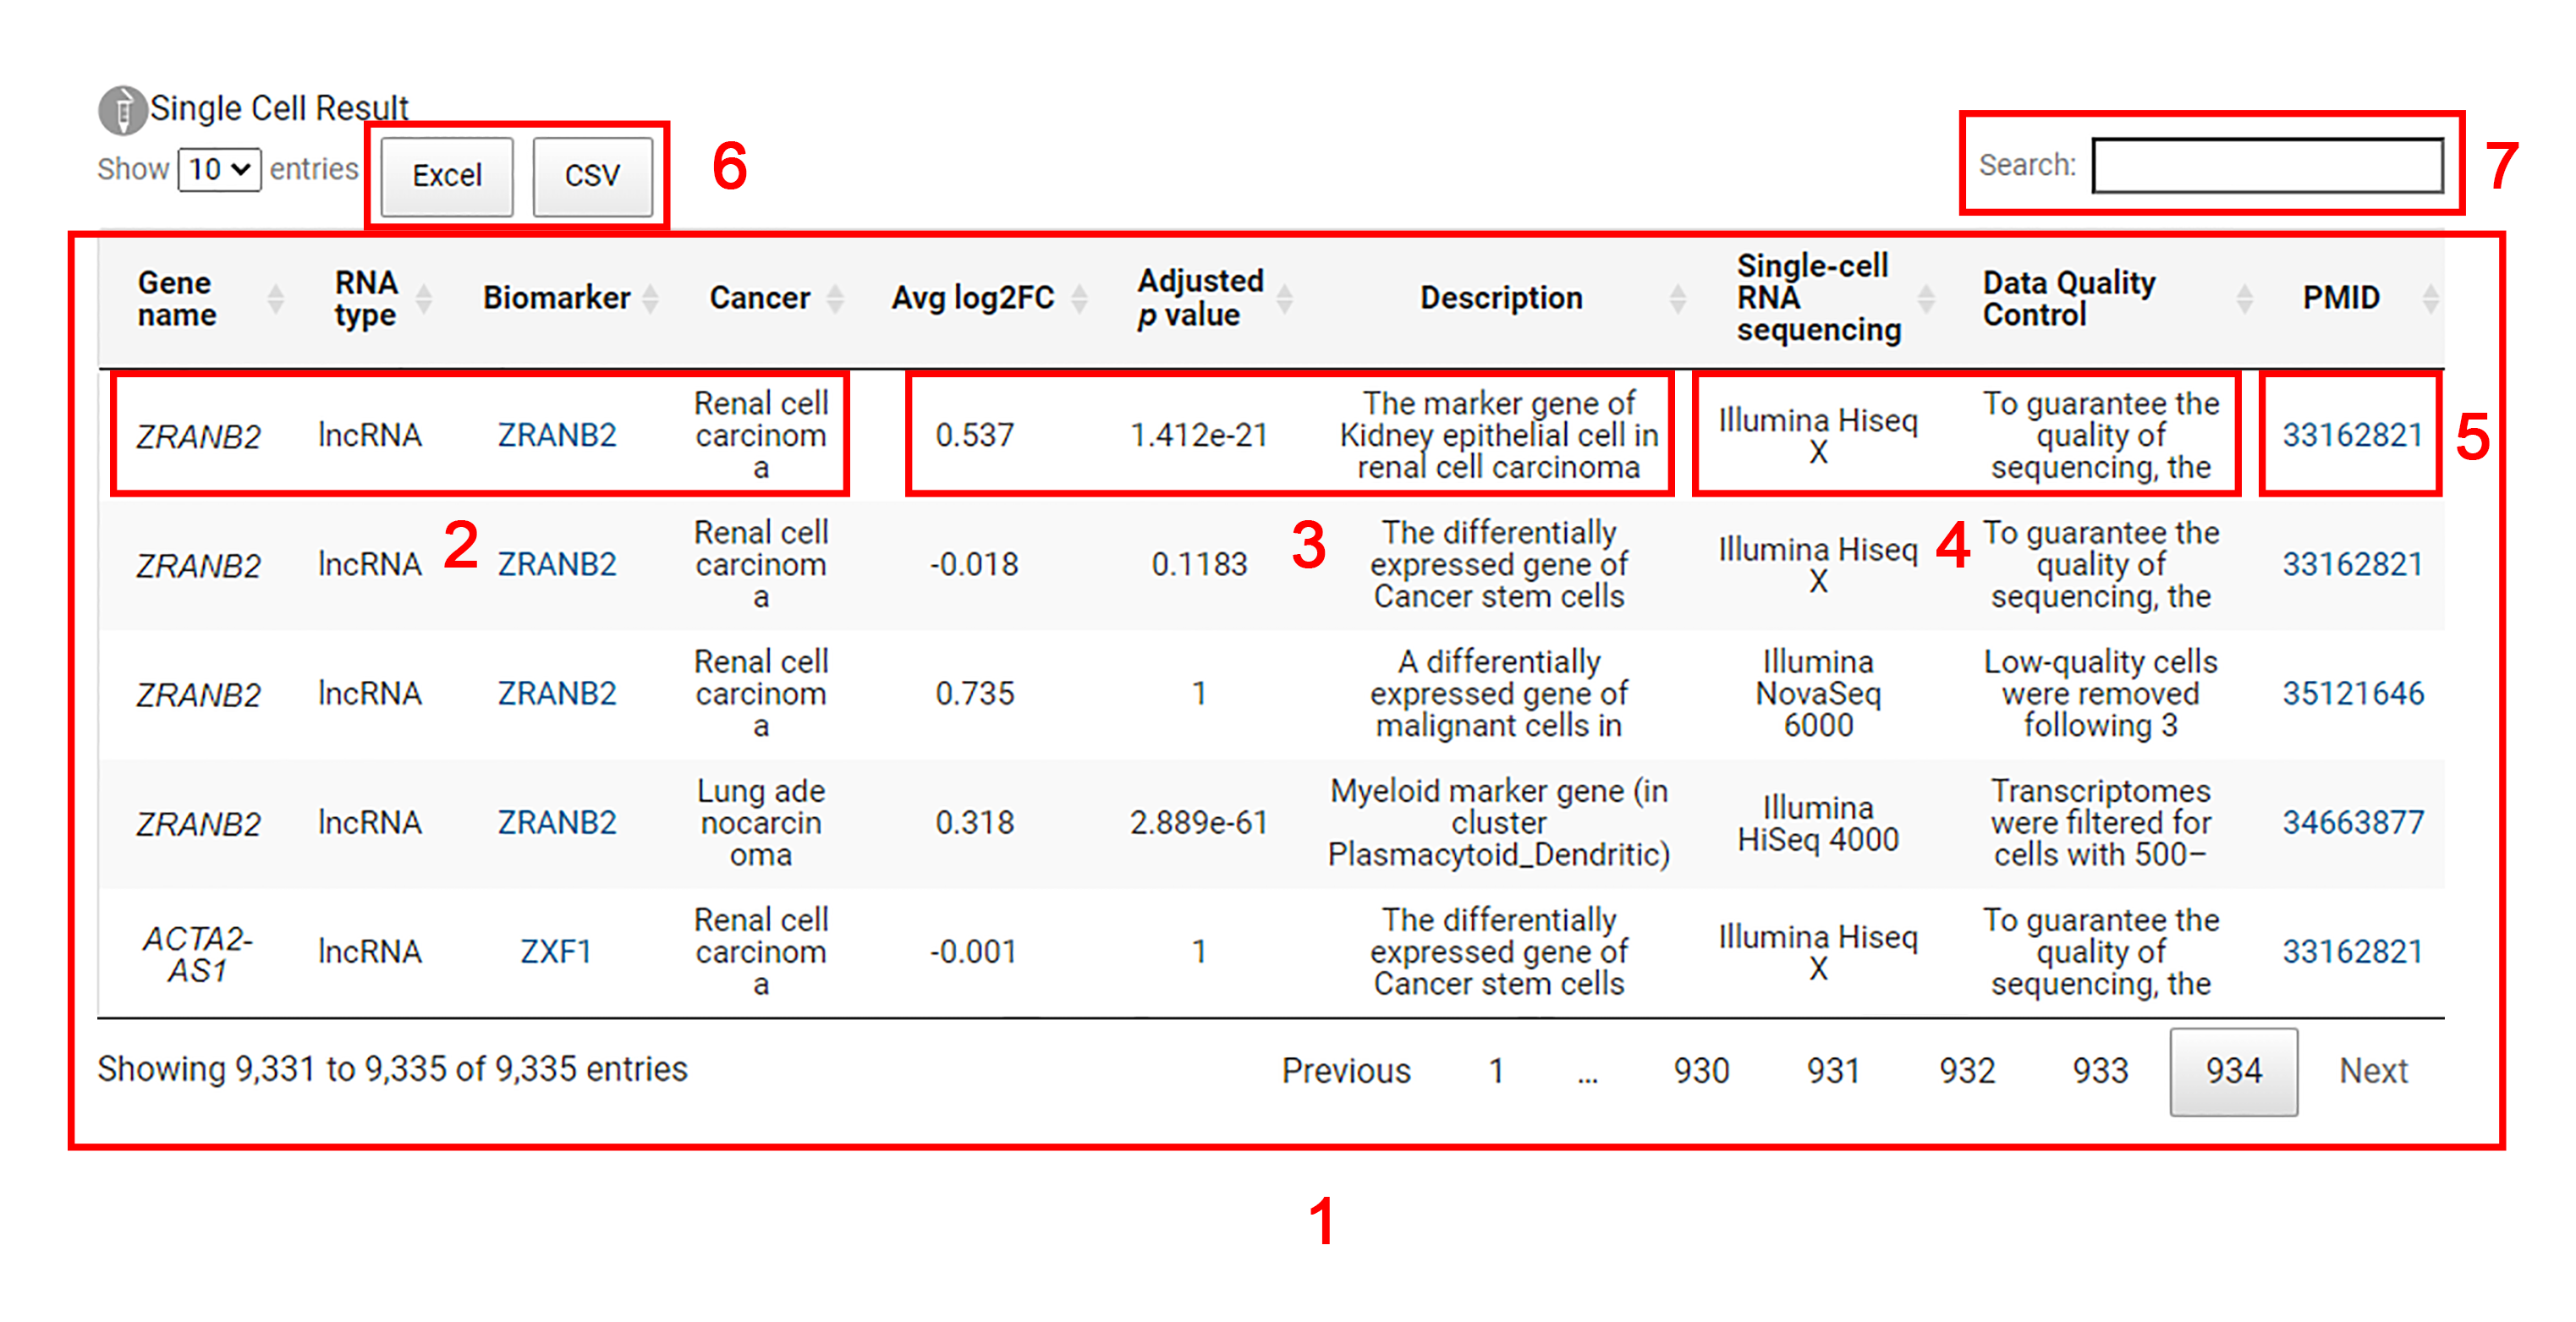
Single cell Result

1. The results of single-cell sequencing analysis for the corresponding genes of the biomarkers are displayed.
2. Each entry includes the name of the gene, the corresponding biomarker, the RNA type of the biomarker and the cancer implicated in single-cell sequencing analysis.
3. Users can explore the average log2 fold change value, adjusted p-value and description of the gene in the differential expression analysis at the single-cell level.
4. Users can obtain sequencing platform information and quality control steps in single-cell sequencing analysis.
5. Users are allowed to acquire more detailed information in the original literature by clicking the 'PMID' link.
6. Single cell results can be downloaded in excel or csv format.
7. Input an interested gene or RNA biomarker for search.

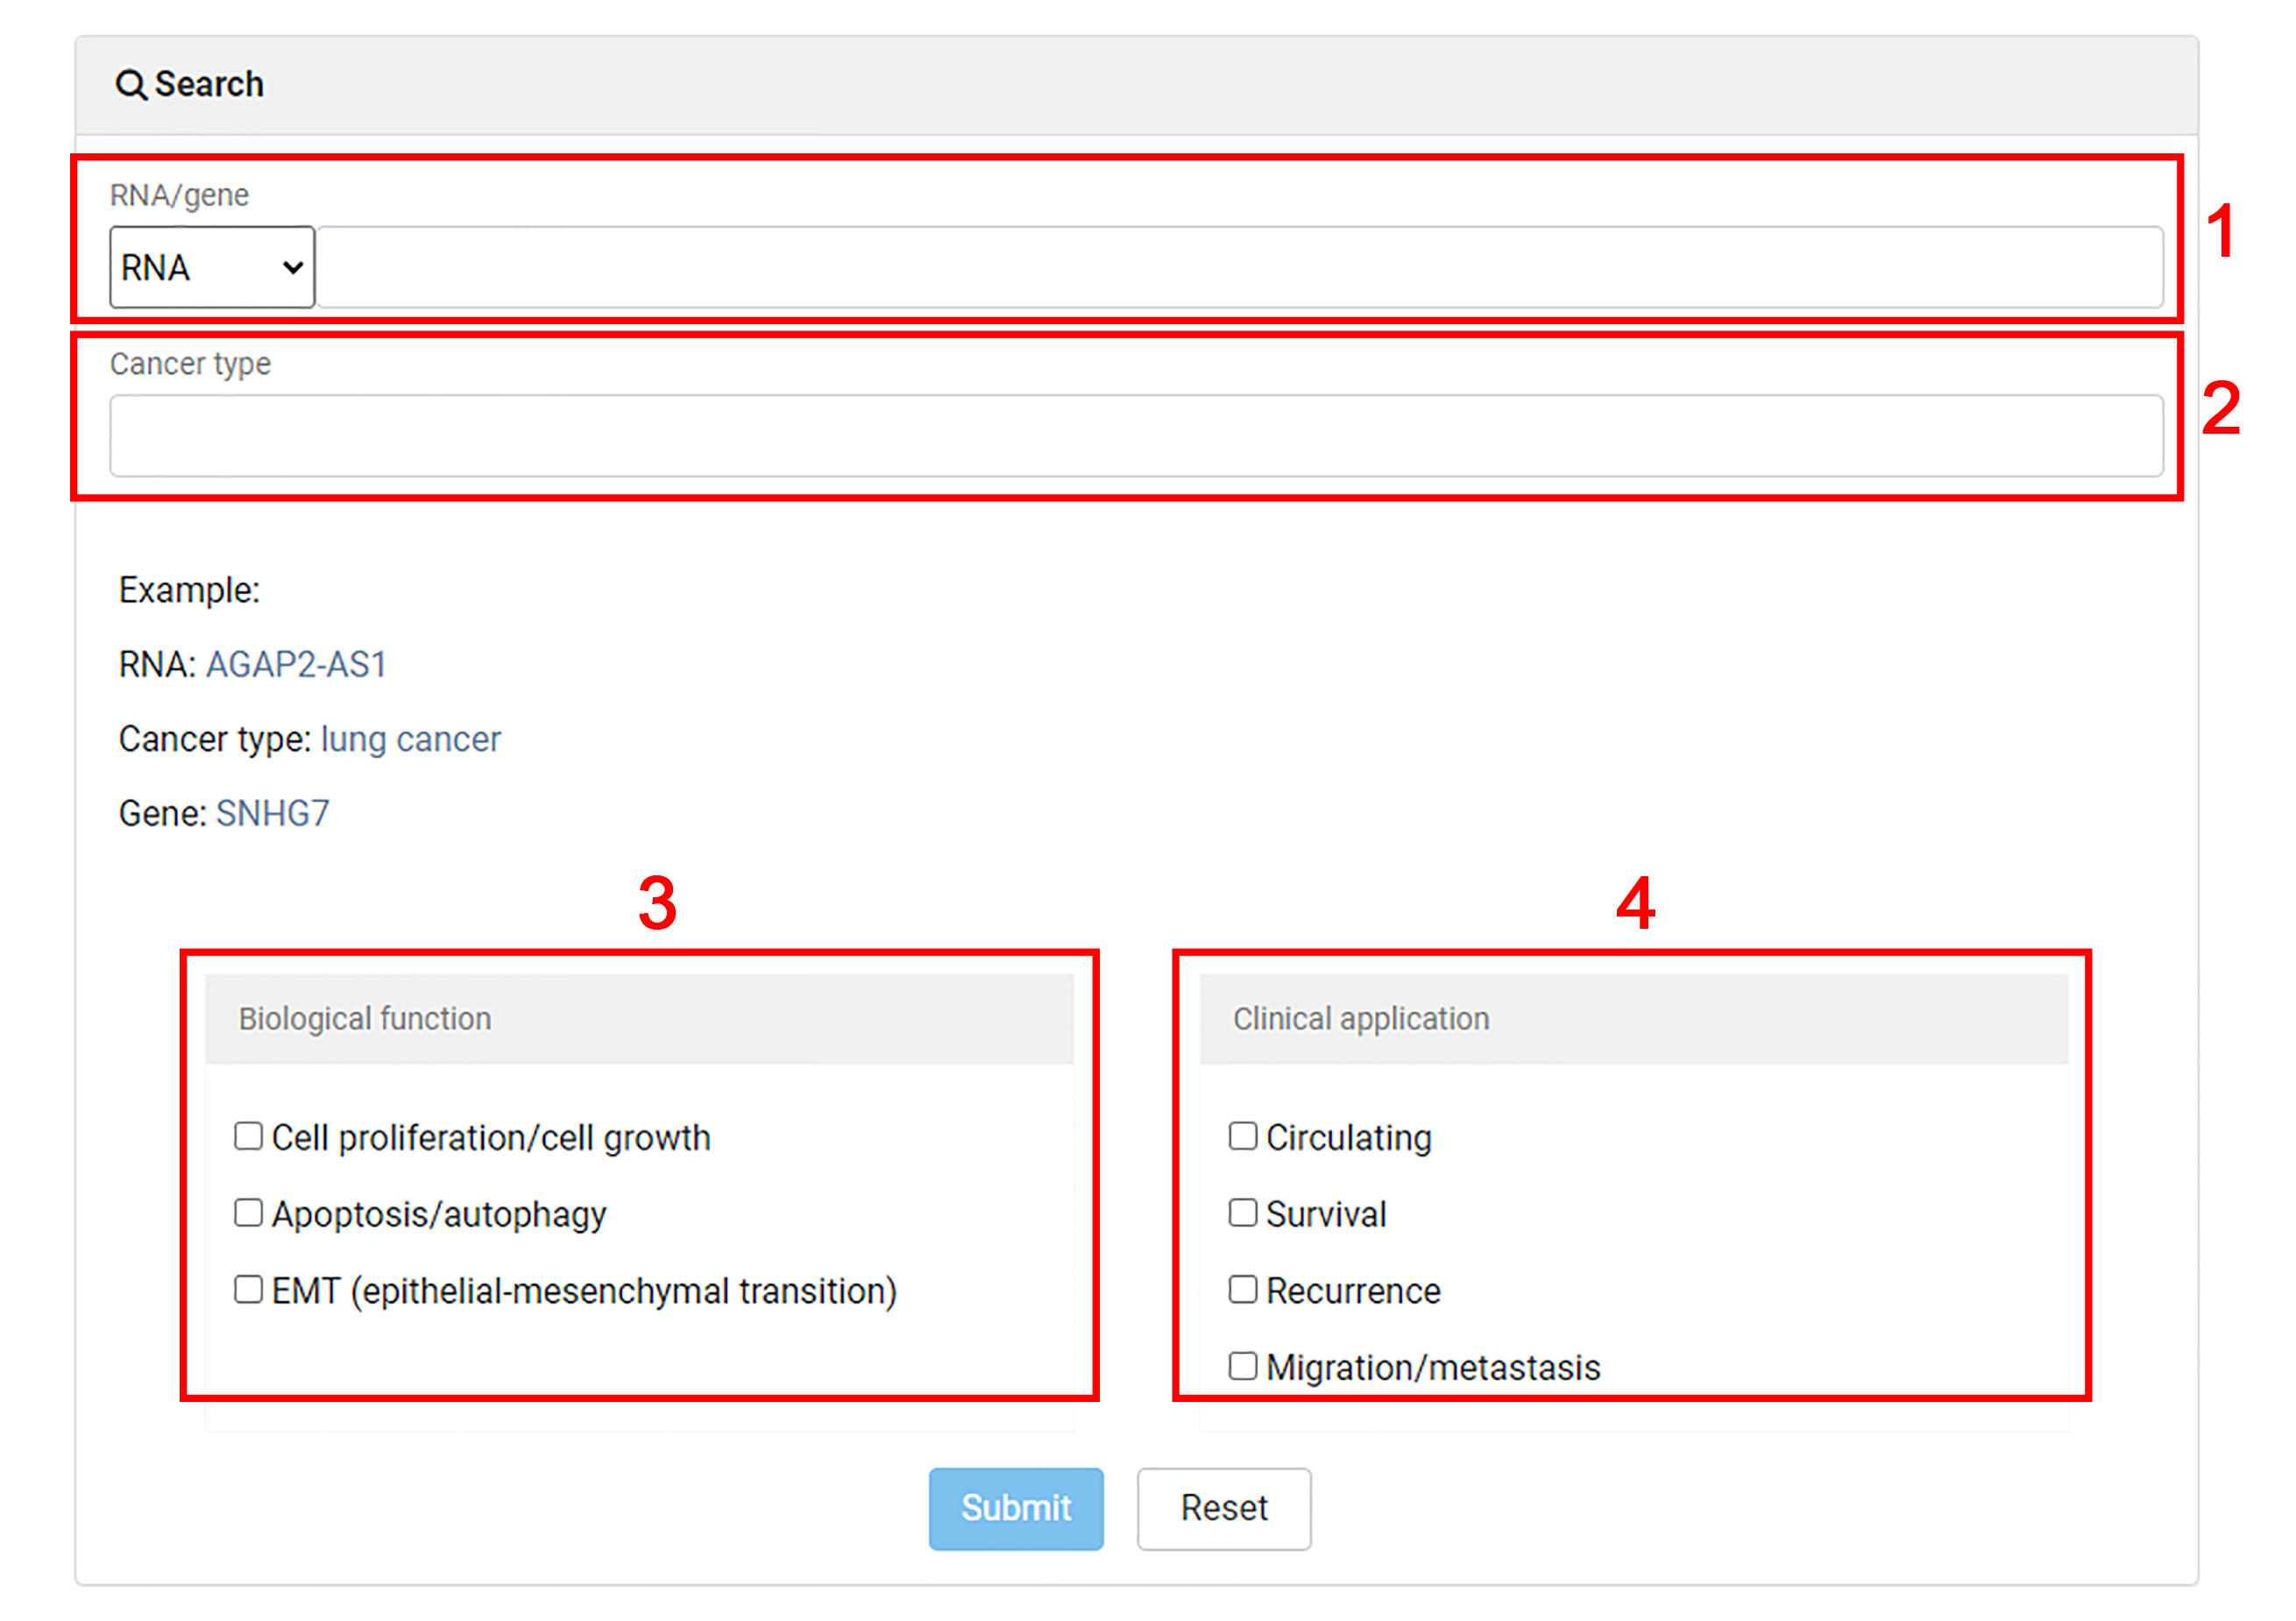
1. Users are allowed to search for non-coding RNA biomarkers by RNA name or gene name.
2. Input an interested cancer type to search for non-coding biomarkers.
3. Select some interested biological functions for advanced search.
4. Select some interested clinical applications for advanced search.

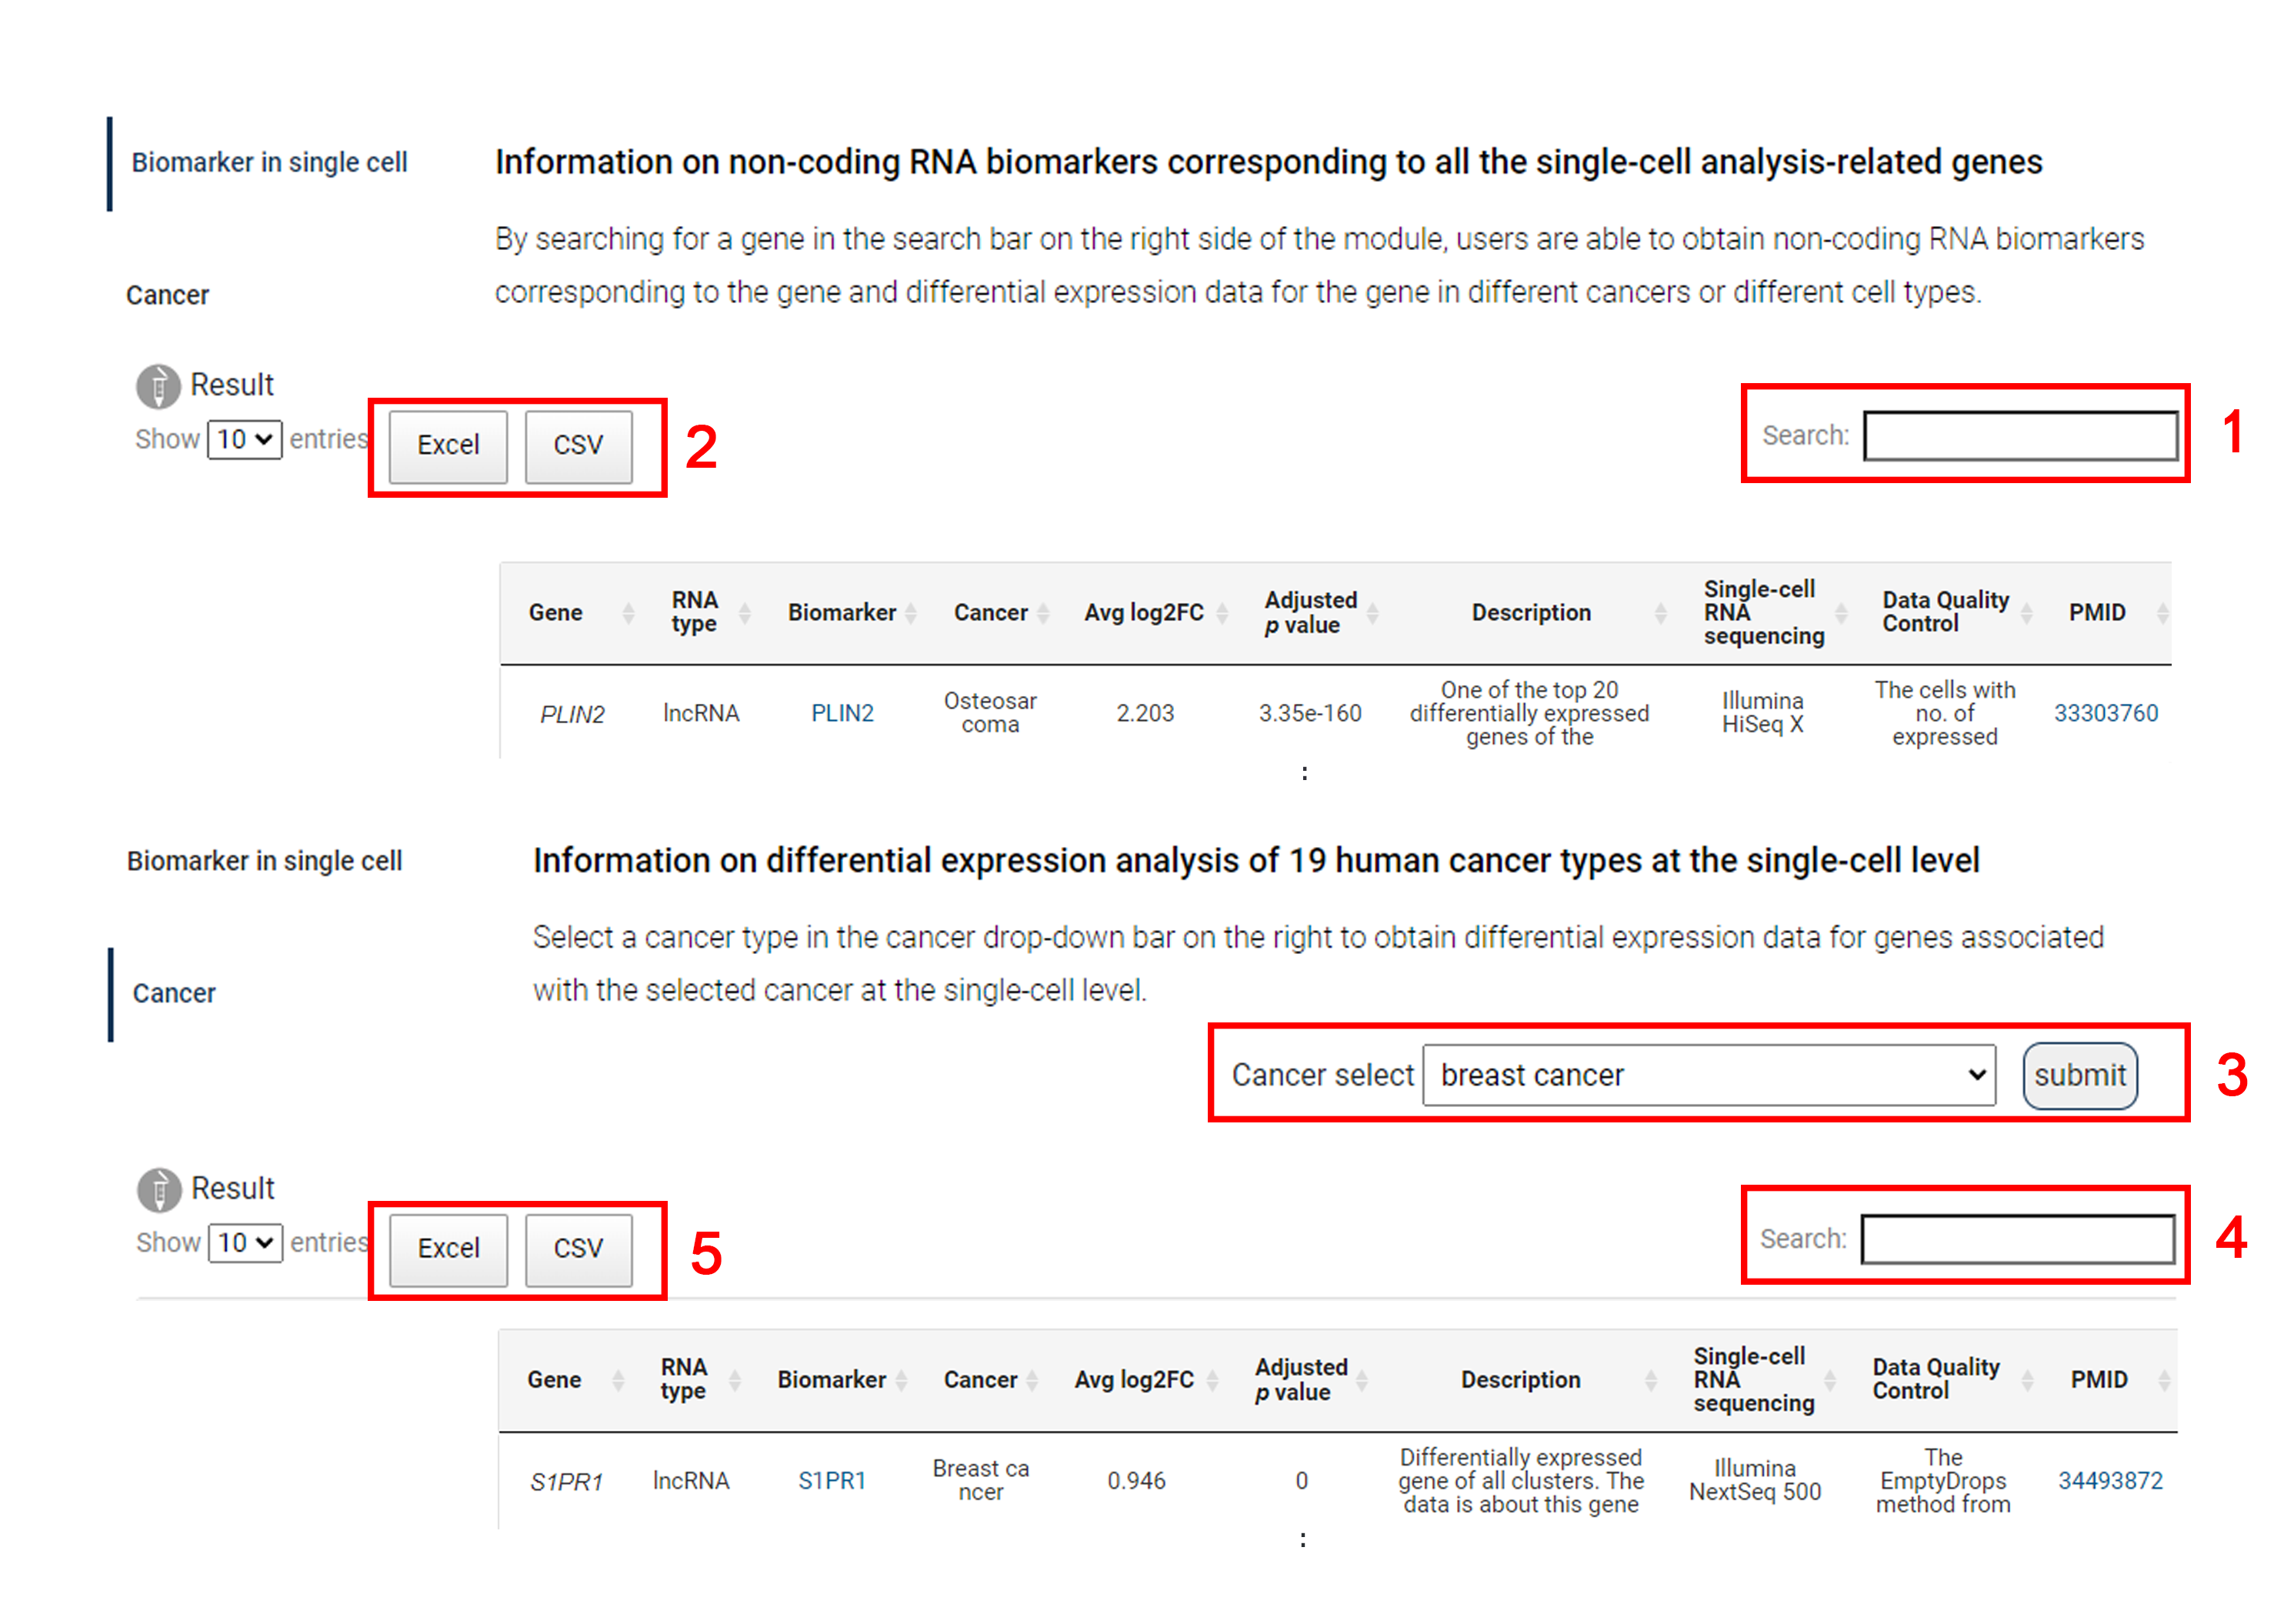
SCancerRNA provides two modules on the ‘single cell’ page, which allows users to easily access biomarkers associated with genes of interest and to discover single-cell expression data associated with specific cancers.
1. By searching for a gene in the search bar on the right side of the module, users are able to obtain the differential expression data for the gene in different cancers and different cell types and the SCancerRNA link of the corresponding biomarker.
2. In the ‘Biomarker in single cell’ module, results can be downloaded in excel or csv format.
3. Users are able to select a cancer type in the cancer drop-down bar on the right to obtain differential expression data for genes associated with the selected cancer at the single-cell level.
4. Input an interested gene or RNA biomarker for search.
5. In the ‘Cancer’ module, results can be downloaded in excel or csv format.
The visualization of detailed statistics of SCancerRNA is provided in the "Statistics" page.
Users can explore the data through visualizations according to their needs.
All the data from the SCancerRNA database can be accessed on the ‘Download’ page.
Users can click the arrow symbol next to the file to download their interested data.
Users need to input their data into corresponding blanks and submit. Users can also select the biological functions and clinical applications of each biomarker to provide more detailed and comprehensive information for SCancerRNA.
We will further curate the submitted information to determine whether to add the new entries to the database or not.
